Файл:T-test vs equivalence test.png
Перейти к навигации
Перейти к поиску
Размер этого предпросмотра: 800 × 449 пкс. Другие разрешения: 320 × 180 пкс | 640 × 359 пкс | 1024 × 575 пкс | 1280 × 718 пкс | 2889 × 1621 пкс.
Исходный файл (2889 × 1621 пкс, размер файла: 589 КБ, MIME-тип: image/png)
Краткое описание
| Описание |
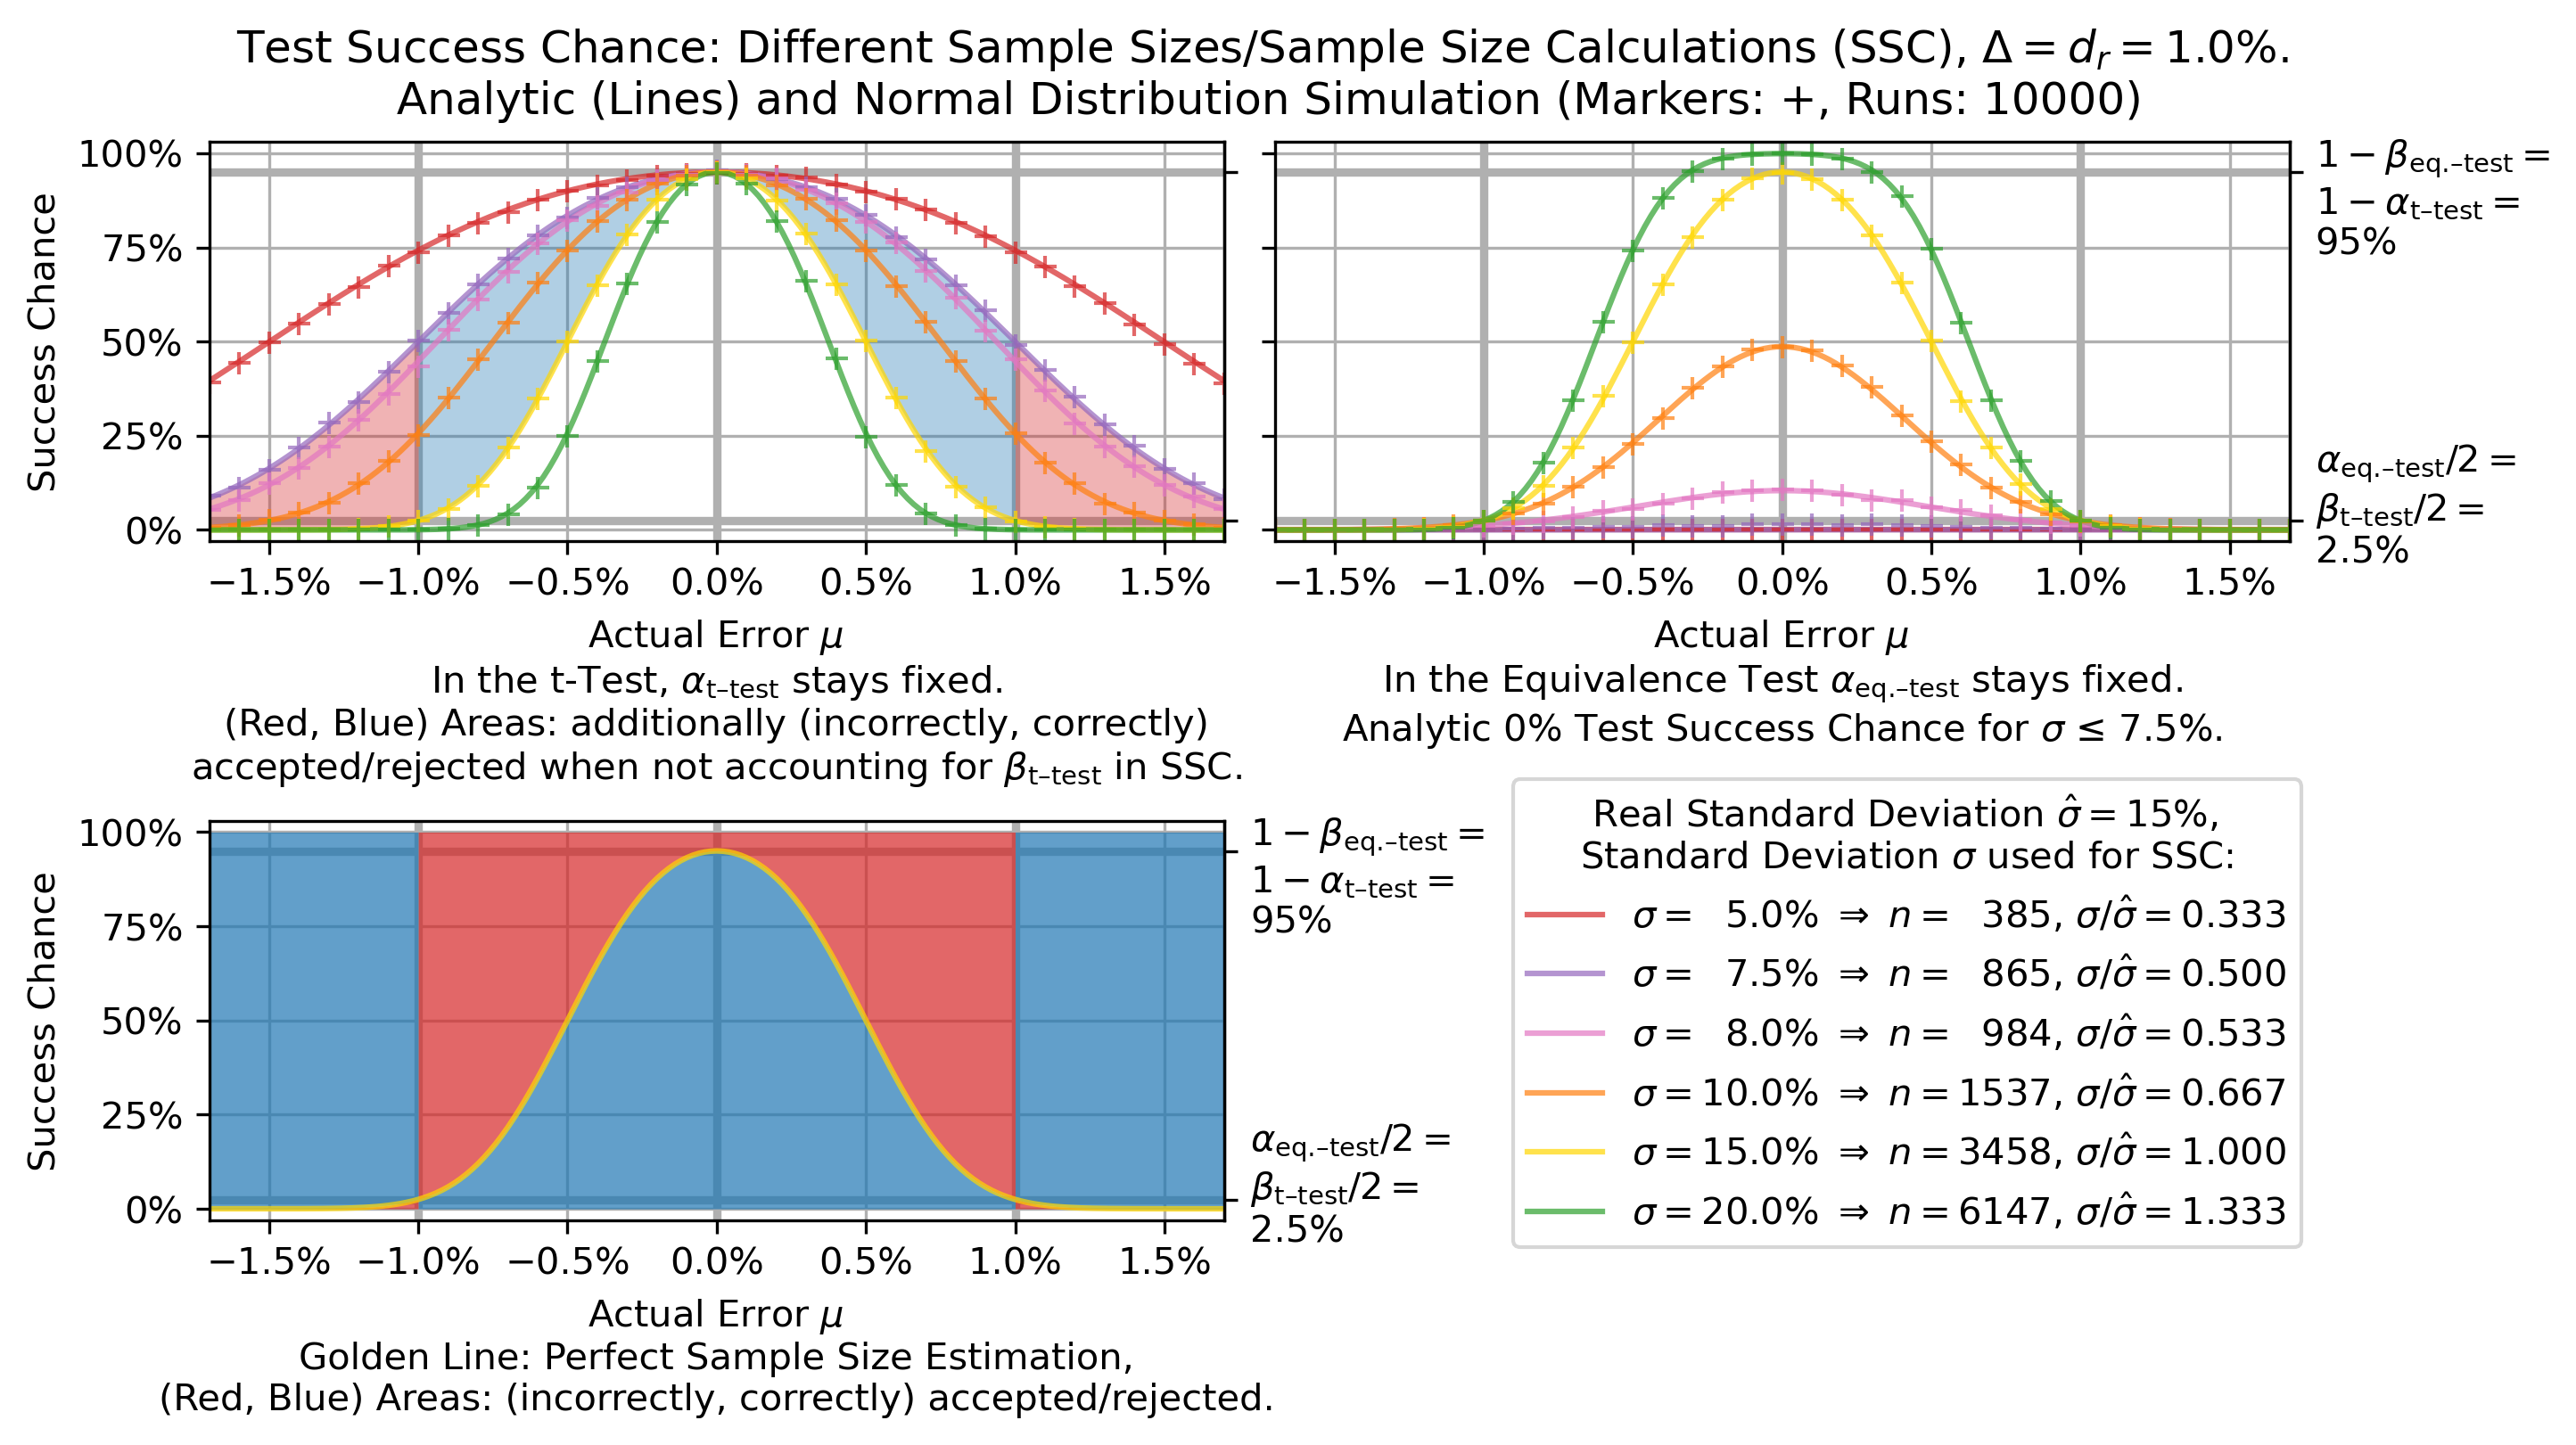
English: Chances to pass the t-test or the equivalence test depending on the actual error 𝜇. Different lines denote different sample sizes obtained from different a priori choices of the standard deviation σ. The golden, solid curve always represents a correctly estimated sample size, the green curve a sample which is too large and the other curves samples which are too small. Neglecting the t-test type II (or the equivalence test type I) error implies a power of 50%. The thick grey lines denote 𝛥=1%. For comparison: in the bottom graph, the incorrect decisions of a reference test are red, the correct decisions are coloured blue. The reason for red areas to exist are economic considerations to limit the test costs: further increasing the sample size towards infinity would make the red areas disappear, at least for the revised t-test or the equivalence test. For the t-test, the areas with systematic error 𝜇>1% and 𝜇<−1% remain blue, but the inner turns red. This behaviour is counterintuitive to the idea that the error of a statistic test goes to zero as the sample size goes to infinity.
Original Source: Figure 2 from https://doi.org/10.1007/s11116-019-09991-9 Reworked version source code see https://gist.github.com/xor2k/2256abe4106cc8ac04a24f42bd36f2c6 |
| Дата | |
| Источник | Собственная работа |
| Автор | Xor2k |
Лицензирование
Я, владелец авторских прав на это произведение, добровольно публикую его на условиях следующей лицензии:
Этот файл доступен по лицензии Creative Commons «С указанием авторства — С сохранением условий» версии 4.0 Международная
- Вы можете свободно:
- делиться произведением – копировать, распространять и передавать данное произведение
- создавать производные – переделывать данное произведение
- При соблюдении следующих условий:
- атрибуция – Вы должны указать авторство, предоставить ссылку на лицензию и указать, внёс ли автор какие-либо изменения. Это можно сделать любым разумным способом, но не создавая впечатление, что лицензиат поддерживает вас или использование вами данного произведения.
- распространение на тех же условиях – Если вы изменяете, преобразуете или создаёте иное произведение на основе данного, то обязаны использовать лицензию исходного произведения или лицензию, совместимую с исходной.
История файла
Нажмите на дату/время, чтобы увидеть версию файла от того времени.
| Дата/время | Миниатюра | Размеры | Участник | Примечание | |
|---|---|---|---|---|---|
| текущий | 14:06, 30 октября 2021 | | 2889 × 1621 (589 КБ) | wikimediacommons>Xor2k | stricter adhere to original diagram, using α_{t-test} instead of α_t etc. |
Использование файла
Следующая страница использует этот файл: