Файл:Ozone cfc trends.png
Перейти к навигации
Перейти к поиску
Размер этого предпросмотра: 517 × 600 пкс. Другие разрешения: 207 × 240 пкс | 414 × 480 пкс | 662 × 768 пкс | 1096 × 1271 пкс.
Исходный файл (1096 × 1271 пкс, размер файла: 123 КБ, MIME-тип: image/png)
Краткое описание
| Описание |
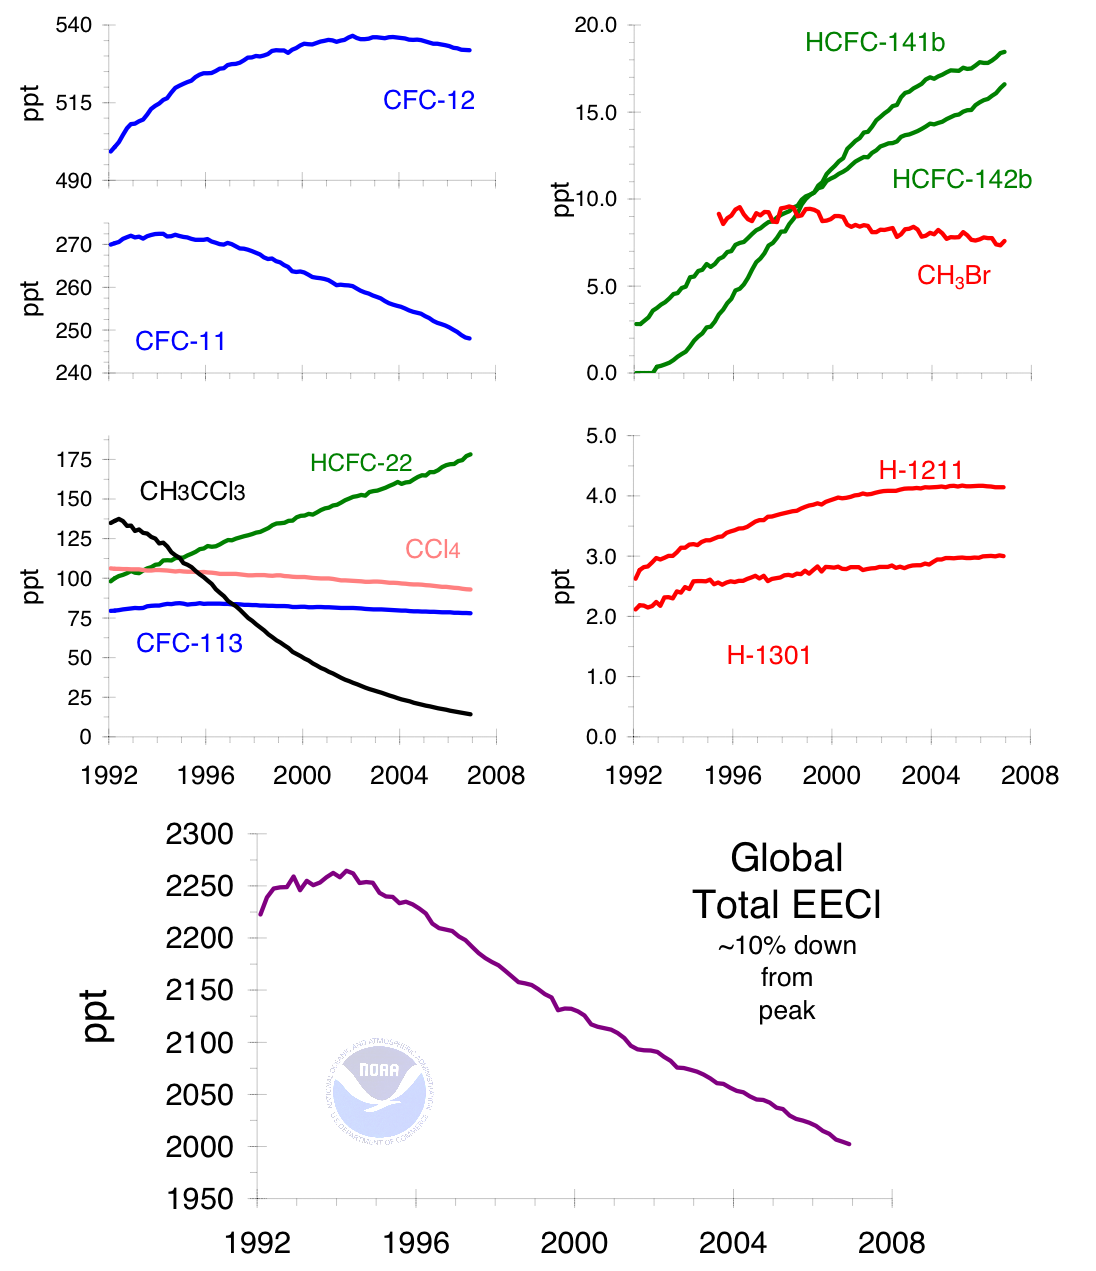
English: Ozone-depleting gas trends and equivalent chlorine effect. Combined chlorine and bromine in the lower atmosphere or troposphere from the most abundant chlorinated and brominated chemicals controlled by the Montreal Protocol. These changes are reflected in the upper atmosphere stratosphere (10-25 km), where most ozone loss occurs, with a delay (due to air transport) of 3-5 years. Bromine is included as an ozone-depleting chemical because although it is not as abundant as chlorine, it is 45 to 60 times more effective per atom in destroying stratospheric ozone. Earlier measurements showed that the peak of equivalent chlorine (chlorine + 45 (or 60) times bromine) occurred at the surface between mid-1992 and mid-1994.[1]
The observed decrease is driven by a large and rapid decline in methyl chloroform and methyl bromide, gases that are regulated internationally by the Montreal Protocol. The initial decline in methyl bromide was larger than that expected from projections given in the WMO/UNEP 2002 Scientific Assessment to Ozone Depletion.[2][3]
Français : Tendances pour les gaz appauvrissant la couche d'ozone (et effet en équivalent-chlore). Chlore et brome sont les halogènes destructeurs d'ozone les plus abondants, ils sont contrôlés par le Protocole de Montréal qui a permis leur réduction globale dans la haute atmosphère stratosphère (10-25 km), où la plupart de l'ozone se crée. Les effets apparaissent avec un retard de 3 à 5 ans (dû au transport aérien des CFC). Le brome est bien moins abondant que le chlore, mais il est 45 à 60 fois plus efficace par atome pour détruire l'ozone stratosphérique. Des mesures antérieures ont montré que le pic en «équivalent-chlore» (chlore + 45 (ou 60) fois brome) s'est produit à la surface entre mi-1992 et mi-1994 [1]. La diminution observée est due à une baisse importante et rapide du chloroforme de méthyle et du bromure de méthyle, pesticide et biocide gazeux réglementés mondialement par le Protocole de Montréal|Protocole de Montréal. La baisse initiale du bromure de méthyle a été plus importante qu'attendue par les projections de l’évaluation scientifique OMM / PNUE de 2002 sur l’appauvrissement de la couche d’ozone. [2] [3] |
| Источник |
Перенесено с en.wikipedia на Викисклад участником Maksim. ftp://140.172.192.211/hats/Total_Cl_Br/totCl_2004.ps from CMDL Data Archive: http://www.cmdl.noaa.gov/info/ftpdata.html |
| Автор | |
| Другие версии |
|


|
Этот график желательно воссоздать или аккуратно преобразовать в векторный формат SVG. Это даёт несколько преимуществ, прочитать о которых подробнее вы можете на странице Commons:Media for cleanup. Если вам уже сейчас доступна векторная версия данного изображения, загрузите её, пожалуйста, а затем замените этот шаблон на следующий: {{Vector version available|Имя загруженного файла.svg}}.
|
Лицензирование
Это произведение находится в общественном достоянии, поскольку содержит материалы Национального управления океанических и атмосферных исследований США, полученные его сотрудниками в ходе выполнения должностных обязанностей.
|
References
- ↑ a b News Release Feb 6, 2001. Climate Monitoring and Data Laboratory (March 17). Archived from the original on 2006-09-29. Retrieved on 2006-01-15.
- ↑ a b CMDL Scientists find that ozone-depleting bromine is now on the decline. Climate Monitoring and Data Laboratory (June 9). Archived from the original on 2006-09-29. Retrieved on 2006-01-15.
- ↑ a b Halocarbons and other Atmospheric Trace Species. Climate Monitoring and Data Laboratory Summary Report #27 (March 17). Archived from the original on 2007-02-21. Retrieved on 2006-01-15.
Original edit history
Первоначальная страница описания находилась здесь. Все нижеперечисленные имена участников относятся к en.wikipedia.
| Дата/время | Участник | Примечание |
|---|---|---|
| 9 июня 2005, 20:44 | en:User:SEWilco | /* References */ more complete version |
| 2 апреля 2005, 21:16 | en:User:SEWilco | link to 3rd reference |
| 2 апреля 2005, 15:34 | en:User:Mozzerati | /* References */ make into numbered list, but what's the last reference? It's not used? See [[Wikipedia:Footnote3]] |
| 2 апреля 2005, 15:33 | en:User:Mozzerati | update {{endnote| template to be {{note| according to recent consensus. See [[Wikipedia:Footnote3]] and talk page. |
| 18 марта 2005, 06:32 | en:User:SEWilco | updates |
| 18 марта 3005, 05:33 | en:User:SEWilco | updates |
| 18 марта 2005, 05:11 | en:User:SEWilco | CFC gas trends. ==Related images== <gallery> Image:Major greenhouse gas trends.png|Greenhouse gas trends </gallery> ==Source== {{PD-USGov-DOC-NOAA}} Source: http://www.cmdl.noaa.gov/hats/graphs/graphs.html or ftp://ftp.cmdl.noaa.gov/hats/graphs/ |
История файла
Нажмите на дату/время, чтобы увидеть версию файла от того времени.
| Дата/время | Миниатюра | Размеры | Участник | Примечание | |
|---|---|---|---|---|---|
| текущий | 23:00, 2 октября 2016 | | 1096 × 1271 (123 КБ) | wikimediacommons>Cmdrjameson | Compressed with pngout. Reduced by 46kB (27% decrease). |
Использование файла
Следующая страница использует этот файл: